stockunlimited
Image
Find and create
Video
Create with AI
Animate and edit
Image
Find and create
Video
Create with AI
Animate and edit
Design templates
Free to edit. Premium: 1 credit, once, when you first download or save it, with its photo or your own.
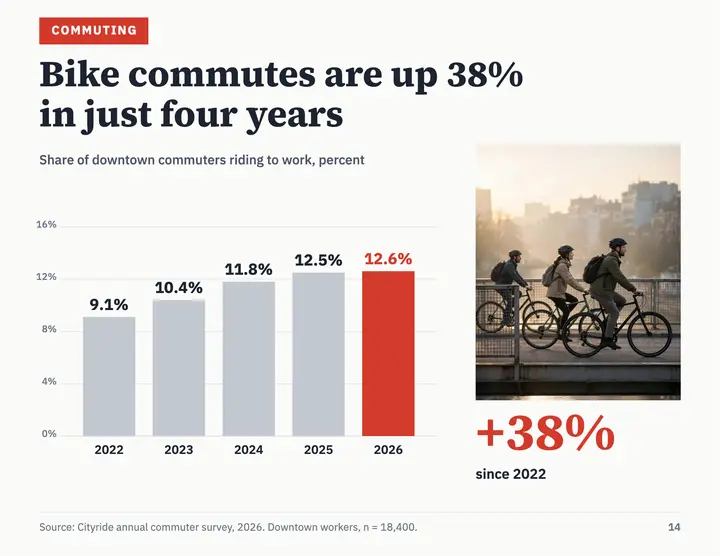
Data chart slide template — Bike commute growth
An editorial presentation slide that leads with its conclusion: bike commutes up 38 percent in four years, a simple bar chart with one highlighted bar, direct labels, a source line and a photo of riders crossing a bridge.
Landscape flyer · 1650×1275 px · Premium · 1 credit
- Every word editable
- 28 sizes
- Your photos or licensed stock
What you can change
- The photoKeep the sample, upload yours, pick one from your Library or search stock photos
- 22 pieces of textYour words, in IBM Plex Sans, Source Serif 4 or any other font
- ColorsRecolor any piece, or apply your brand colors to the whole design
- LayoutMove, resize, align or delete anything; add shapes, stickers and your logo
- SizeLandscape US Letter flyers and menus, at 1650×1275 px
How to use it
- 1Open the design
It opens in the image editor in your browser, with every piece as its own layer.
- 2Make it yours
Click any text to change it, swap in your photos and pick your colors.
- 3Download it
Download a PNG, JPG or WebP at full size, or save it to your Library.
More designs like this
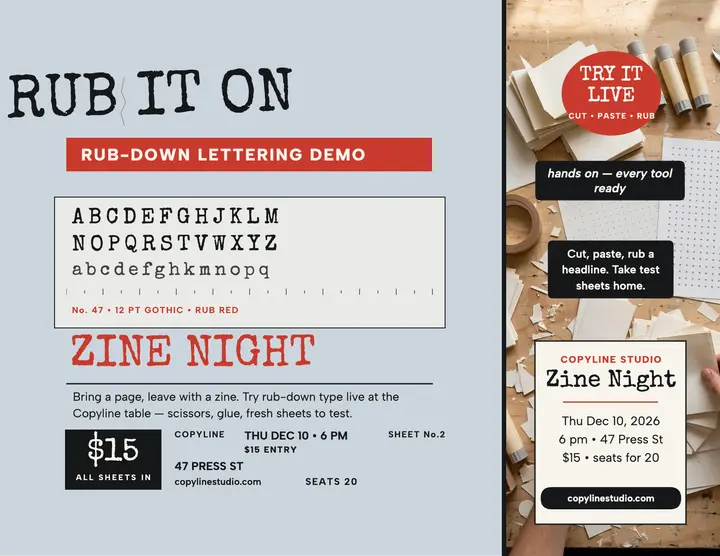 Copyline Studio zine night workshop flyer
 Kestrelby & Vane free consultation flyer
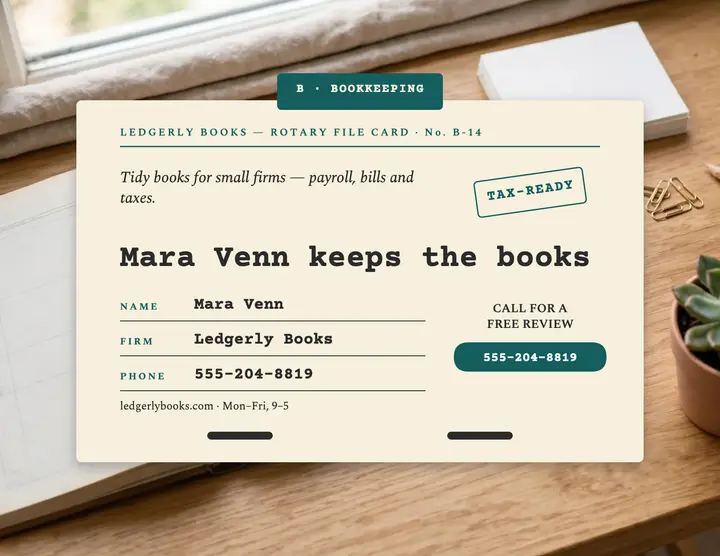 Ledgerly Books rotary file contact flyer
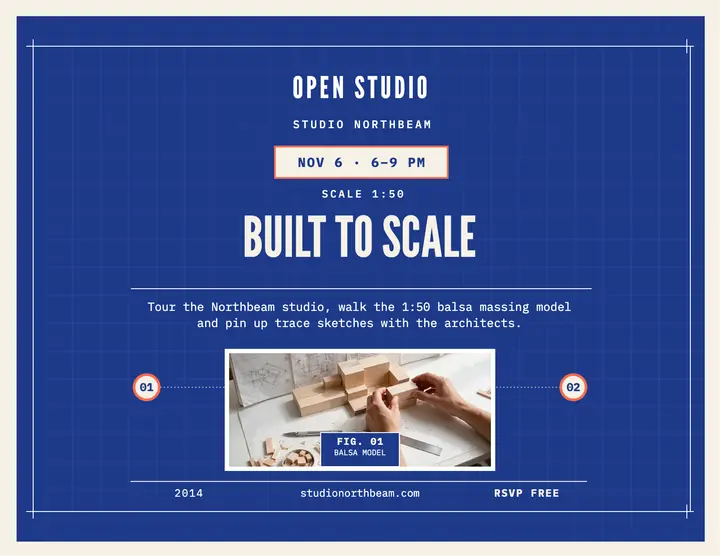 Studio Northbeam open studio blueprint flyer
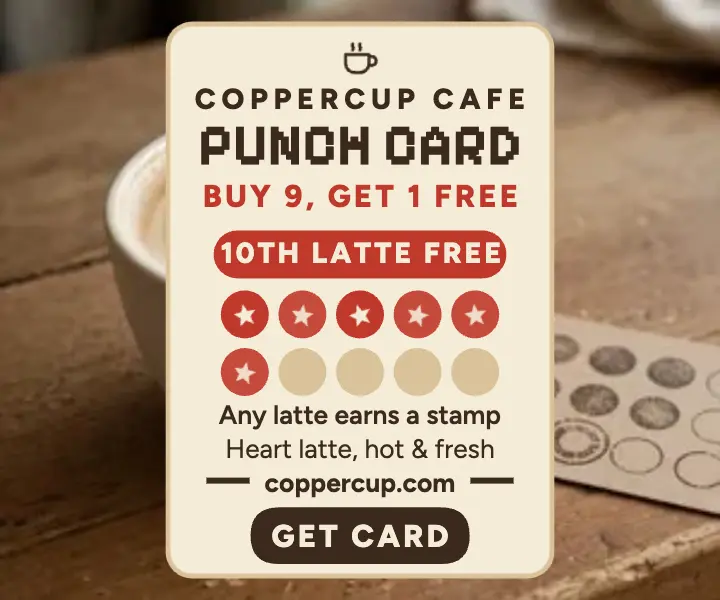 Coppercup punch card loyalty ad
 Ledgerly Studio bookkeeping banner
 Northloop team sync video grid
 Calloway and Beck pleading paper consult ad
Browse more templates
Questions people ask
- What does this design cost?
- Editing it is free. It's a premium design: 1 credit, once, when you first download or save it, with its sample photo or your own. Swapping in a stock photo is licensed when you pick it, like any stock photo.
- What do I get when I download?
- A PNG, JPG or WebP at 1650×1275 px, saved straight to your device. You can also save it to your Library.
- Can I use it for my business?
- Yes: in ads, social posts, flyers and print, for yourself or for clients.